
GTM Tips
Blog that accompanies my BrightonSEO speech. GTM tips to elevate your analytics game.
Finally, Google has introduced a feature many have been waiting for: annotations in Google Analytics 4 (GA4). About damm time!
This fantastic addition allows you to add notes directly within your GA4 reports, providing crucial context to your data.
No more scratching your head trying to remember what happened when that traffic spike occurred!
Annotations mean you can data fluctuations based on specific events or simply highlight key observations for yourself and your team.
Annotations offer a wealth of benefits for understanding and interpreting your website’s performance. Here are a few key ways you can utilise this powerful feature:
By adding these contextual notes, you can truly illuminate what’s happening with your website’s performance and understand the “why” behind the data.
Adding annotations in GA4 is straightforward. You’ll recognise the availability of this feature by the presence of a small post-it note symbol within the report section.
Here are a couple of ways to access the annotation feature:

Let’s walk through the steps of creating an annotation within a report:
Navigate to the desired report (e.g., Traffic acquisition). Although, really anywhere you see the post it note symbol, you are good to go.
Click on the “View annotations” section (if annotations already exist) or directly look for the “Create annotation” button (often found at the bottom of the annotation panel).
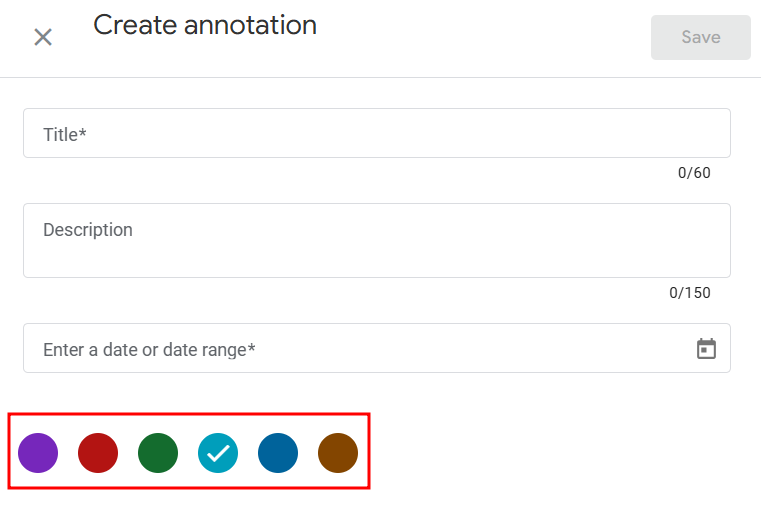
A pop-up window will appear, allowing you to add the following details:
Once you’ve filled in the details, click “Create”. Your annotation will now appear on the relevant line chart as a coloured marker or band (if a date range was selected).
What I like is the ability to colour code the annotations.
I think this is a great opportunity to segment the annotations by type.
Perhaps:
– Algorithm Updates
– Consent Changes
– Content Changes
– Code Changes
– Campaigns starting and ending
– Tag Management Changes
A great aspect of GA4 annotations is that they are not limited to a single report. Once you’ve created an annotation, it will be visible across other relevant reports as well. This ensures you have consistent context regardless of the data you’re analysing.
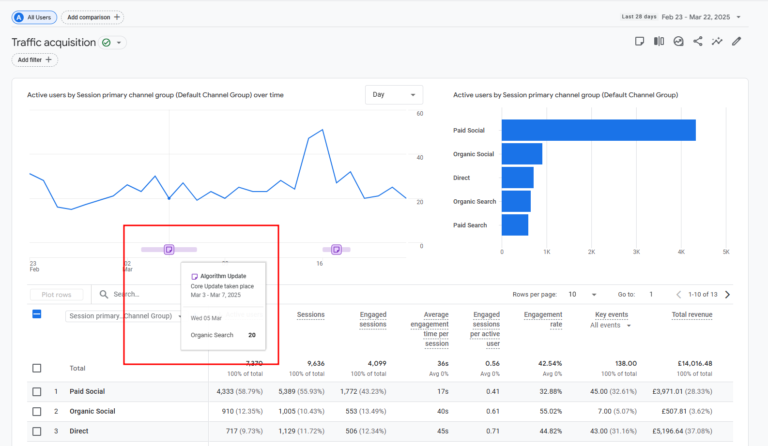
For even deeper insights, you can combine annotations with the “Plot row” option in GA4.
This allows you to overlay specific metrics on the same chart as your annotations, making it easy to visually identify any corresponding upticks or downturns in traffic or other key performance indicators following a particular event or change.
The introduction of annotations in Google Analytics 4 is a welcome and valuable addition for anyone looking to gain a deeper understanding of their website’s data.
By providing crucial context to your reports, annotations empower you to analyse trends, explain fluctuations, and ultimately make more informed decisions about your website strategy. So, don’t delay!
Head over to your GA4 property and start adding annotations today to unlock a richer and more insightful view of your website’s performance.
Blog that accompanies my BrightonSEO speech. GTM tips to elevate your analytics game.

Looking for an easy way to get info from GA4 without navigating various reports, a report snapshot is a great solution. Learn more here.

Author
Hello, I'm Kyle Rushton McGregor!
I’m an experienced GA4 Specialist with a demonstrated history of working with Google Tag Manager and Looker Studio. I’m an international speaker who has trained 1000s of people on all things analytics.