GA4 Path Exploration
Discover how to use the GA4 Path Exploration report to uncover insights into your website’s user behaviour.
Understanding conversion rate is so important in Google Analytics 4 (GA4).
It means that you can understand which channels are providing the greatest value to you and your organisation.
In this blog post
Great question – but not so easy to answer in GA4.
In GA4, there are 2 metrics that are used to understand the performance of a site.
A key event is an event marked as a key event in GA4.
A conversion is a key event that has been imported into Google ads.
The big thing to stress here is that whether you use the terminology ‘key event’ or ‘conversion’, they are both ways to measure success.
So a key event could be:
I’ve seen examples of events such as page_view, form_start, video_start being marked as key events – and to me these aren’t key events. They are important markers to review – that might help towards a key event, but not the key business indicator.
As someone who has spent too long in analytics, I’m struggling to get used to metrics that are named differently. But for the sake of clarity and because these are the official names in GA4, I will now call them key events in this blog.
In GA4, there are 2 types of key event rates.
This is a metric that is not too dissimilar to the one that we saw in Universal Analytics (UA).
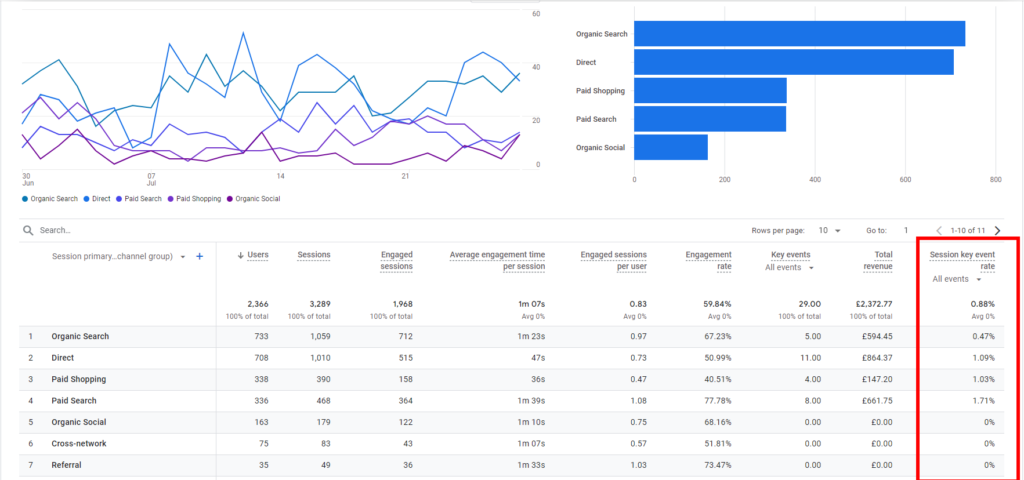
Session Key Event Rate is calculated by dividing the number of sessions with a key event by the number of sessions.
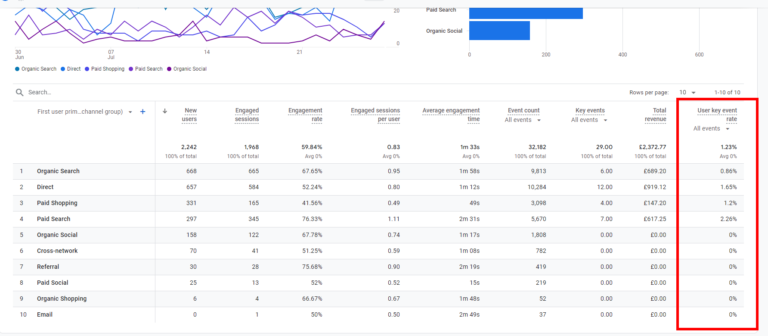
Right, this one had me baffled. Google’s definition of User Key Event Rate is this:
But when I was working with a client and running through a Looker Studio report that I had built – something wasn’t right. What we were seeing in Looker Studio, didn’t match to the what manual calculations we were doing.
After some back and forth – it looks like Google’s own documentation isn’t right here.
So always bear that in mind when talking to clients and other members of the team – it’s active users, not total users.
In the report section – if you head to Life Cycle > Acquisition > Traffic Acquisition, you then have a visualisation of the traffic channel by which users arrived to the site – and the key event rate for each channel.

You can also view User Key Event Rate within Life Cycle > Acquisition > User Acquisition.

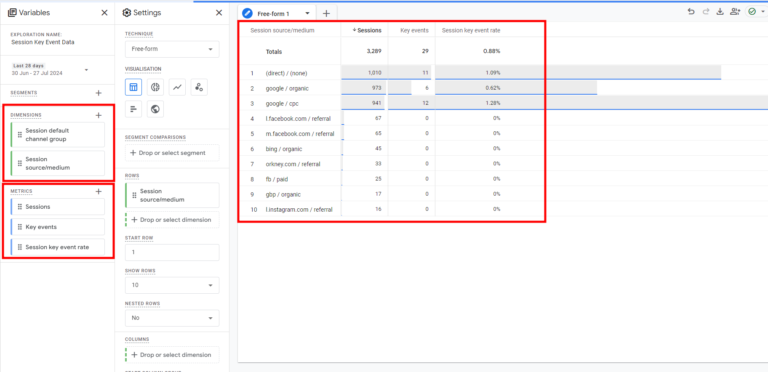
Using the explore function, you can also build out detailed reporting using these key event rates.
Head to the explore section and choose blank.
Here you are then presented with the option to add in metrics and dimensions.
For this example, I’m adding in session source / medium and session default channel group as dimensions and sessions, key events and session key event rate as metrics.

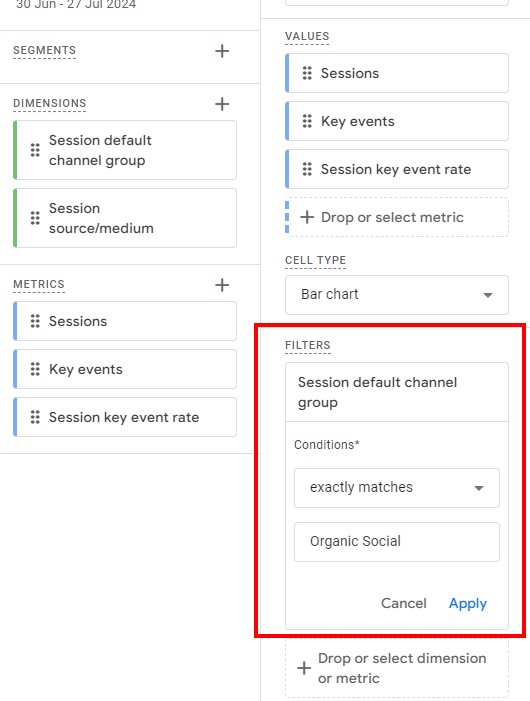
I’ll then add these in, but for this example, I’m not including session default channel group. I’m going to use that as a filter.

This now gives me a report of source medium, filtered to only show organic social traffic.
I can now see which social media channel is driving conversions and which one needs support.
So you can see how using the explore report helps to provide greater granularity.
So there you have it – user key event rate, session key event rate – 2 different ways of understanding how successful your site is converting. Whether or not you gather this information in the report section, or explore, using this info will help you to drive additional success! Get stuck in!

Discover how to use the GA4 Path Exploration report to uncover insights into your website’s user behaviour.

Are you seeing Unassigned in GA4 – what does it mean? How can you fix it?

Author
Hello, I'm Kyle Rushton McGregor!
I have been working in PPC and SEO for over a decade now. I have expertise in supporting charities, SAAS and B2C – helping them drive more traffic and conversions. My experience covers