
GA4 Path Exploration
Discover how to use the GA4 Path Exploration report to uncover insights into your website’s user behaviour.
Let’s be honest, we’ve all done it. You launch a new campaign, a slick new landing page, or a fresh blog post, and what’s the first thing you do? You check it out. Then you check it again. You ask your team to have a look. Before you know it, your internal team has racked up hundreds of page views, and suddenly, your traffic data is looking a little… inflated.
Sound familiar? It’s a classic case of friendly fire in the world of web analytics. Your own team’s activity, while well-intentioned, can seriously muddy the waters of your Google Analytics 4 (GA4) reports. This can lead to
Not ideal when you’re trying to prove ROI, is it?
But what if I told you there’s a straightforward way to ring-fence your internal traffic, ensuring your GA4 data reflects genuine customer interactions? You can either prevent this data from ever being collected or filter it out later.
Ready to clean house? Let’s get to it.
You might be thinking, “Is a little bit of internal traffic really that big of a deal?” Honestly, yes. Think about how your team uses your website compared to a potential customer. Your colleagues are likely visiting specific pages, spending longer on the site, and not following the typical user journey you’ve so carefully mapped out.
This behaviour can throw off some seriously important metrics:
By filtering out this internal noise, you get a much clearer picture of how actual customers are interacting with your site. It’s about ensuring the data you rely on to make strategic decisions—from budget allocation to content strategy—is as accurate as humanly possible.
Right, let’s get into the nitty-gritty. The process involves two main stages: first, telling GA4 which IP addresses belong to your team, and second, deciding what to do with that traffic.
First things first, you need to let Google Analytics know which visitors are “internal.” This is done by creating a rule based on IP addresses.

Now you’re ready to create your first rule. Click the ‘Create’ button. This is where you tell GA4 how to identify the traffic you want to exclude.
traffic_type parameter is set to ‘internal’. For most cases, this is all you need. However, you can get clever here. You could create different values like ‘development_team’ or ‘marketing_agency’ if you want to segment different types of internal traffic later on. More on that in a bit.Once you’ve added your IP(s), hit ‘Create’.
And that’s the first part done. You’ve successfully flagged internal traffic.
But hold on, we’re not finished yet. The data is still flowing into your reports.
Now we need to tell GA4 what to do with it.
This is where you decide the fate of your internal traffic data. Do you block it at the door, or do you let it in and just keep it in a separate room?
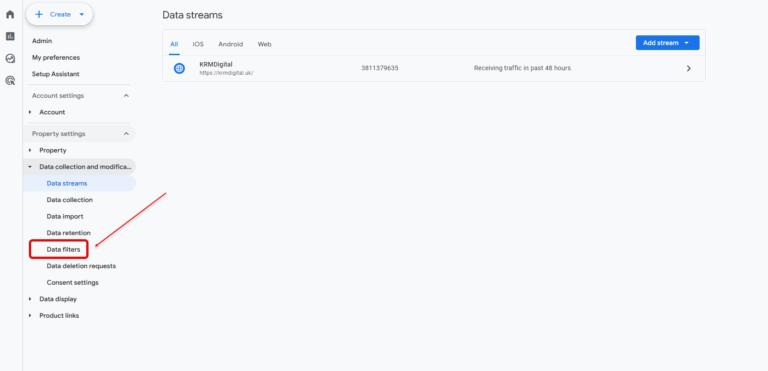
Head back to the ‘Admin’ panel, and under ‘Data collection and modification’, click on ‘Data Filters’.
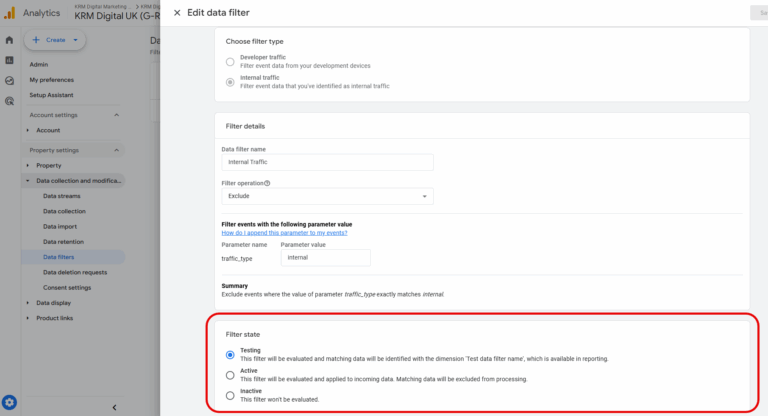
You’ll see the ‘Internal Traffic’ filter you’ve just set up, but its state will be ‘Testing’. This is the default, and it’s a crucial setting.
Here’s what the different filter states mean:
Testing: This is the default mode. In this state, GA4 identifies and labels the internal traffic but still includes it in your reports. It adds a new dimension called ‘Test data filter name’. This is incredibly useful because it allows you to apply a filter to your reports to see only the internal traffic or compare it against everything else. You can verify that your rules are working correctly before you commit to excluding the data permanently. The data is still there, you just have the power to isolate it.
Active: This is the “point of no return” option. When you set the filter to ‘Active’, any traffic that matches your IP rules will be permanently excluded from being processed into your reports. You will not be able to go back and see this data. It’s gone for good. This is the cleanest option if you’re 100% confident in your setup and want the purest data possible.
Inactive: As the name suggests, this simply turns the filter off. Nothing happens.
Honestly, for most marketing managers, starting with ‘Testing’ is the smart move. Why? It lets you play with the data. You can build comparisons in your reports to see what your data looks like with and without the internal traffic. It gives you a safety net.
Imagine you want to see what your web agency is looking at on the site. If you created a separate traffic_type for them (e.g., ‘web_agency’) and kept the filter in ‘Testing’ mode, you could easily isolate their activity in your reports.
Once you’re completely happy that your filters are correctly identifying the right people, and you no longer need to analyse that internal data, you can switch the filter state to ‘Active’.
It might seem like a lot of clicks, but it’s a logical flow once you’ve done it once. Here it is again, in a nutshell:
And that’s it! You’re good to go.
Taking a few minutes to set up these exclusions is one of the most impactful things you can do for your data hygiene in GA4. It ensures that when you report back on campaign performance or user behaviour, you’re doing so with confidence. No more second-guessing if that spike in traffic was a genuine surge of interest or just your team admiring their own work.
Now you can focus on the insights that truly matter—the actions of your prospective and existing customers. So go on, get those filters set up and start making decisions based on data you can trust.
Discover how to use the GA4 Path Exploration report to uncover insights into your website’s user behaviour.

Are you seeing Unassigned in GA4 – what does it mean? How can you fix it?

Author
Hello, I'm Kyle Rushton McGregor!
I’m an experienced GA4 Specialist with a demonstrated history of working with Google Tag Manager and Looker Studio. I’m an international speaker who has trained 1000s of people on all things analytics.