Data Studio Tips: Build Marketing Reports Faster

August 24, 2026

Building marketing dashboards in Data Studio often becomes a tedious time sink.

You end up spending hours tweaking box alignments, matching custom colour palettes, or answering the same client questions about metric definitions.

Using smart shortcuts, structural controls, and embedded assets can dramatically streamline your dashboard creation process.

Table of Contents

Key Takeaways

    • Copy style formatting instantly between charts using keyboard shortcuts.
    • Align and group elements to adjust layout sections in bulk.
    • Set global controls to report-level so they render automatically across every page.
    • Embed YouTube videos and Google Docs to provide self-serve client documentation.
    • Use page filters and drill-down dimensions to keep reports uncluttered.

Speed Up Dashboard Formatting and Layouts

Re-building charts from scratch is inefficient. These shortcuts let you standardise design elements across your report in seconds:

  • Group elements: Select multiple charts, right-click, and group them to move or resize entire sections together.
  • Paste styles only: Select a formatted chart, press Ctrl + Alt + C, then select your target chart and press Ctrl + Alt + V. Fonts, padding, and colours transfer immediately without altering underlying data settings.
  • Duplicate components: Copy existing charts to retain preset date ranges, data sources, and applied filters.
  • Use smart guides: Enable ‘Snap to Grid’ and smart guides under the View menu to eliminate manual alignment guesswork.
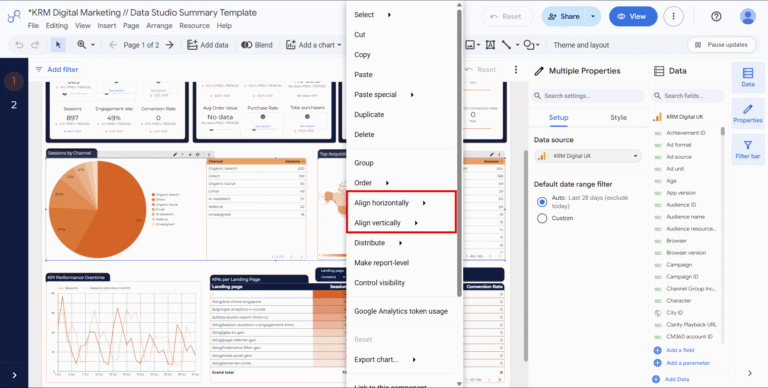
  • Align automatically: Right-click selected components to align them vertically or horizontally with a single click.
Aligning charts in Data Studio

Structuring Multi-Page Dashboards

Applying identical settings across multi-page reports wastes time. Global structural controls solve this issue cleanly:

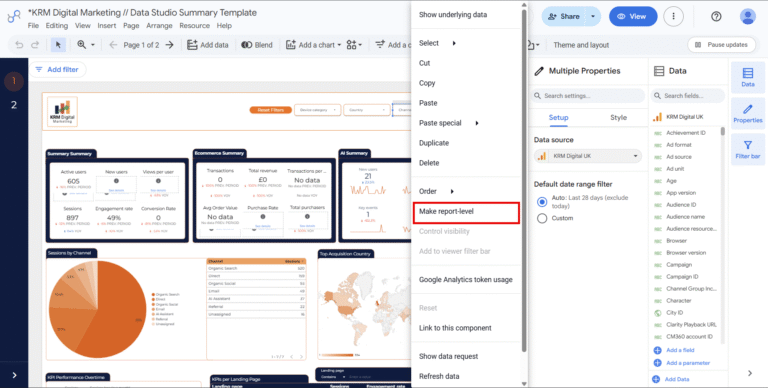
  • Make components report-level: Right-click header banners, logo graphics, date selectors, or channel pickers and toggle ‘Make report-level’ to display them on every page.
  • Extract themes from brand assets: Upload a client logo to automatically extract its colour palette and apply a cohesive visual theme.
  • Apply page-level filters: Set filters at the page level to avoid attaching individual filters to every single chart on that page.
Report Level Data option in Data Studio

Keeping Dashboards Clean Without Omitting Context

Cluttered dashboards confuse stakeholders, but removing detail leaves them seeking clarification.

Embedded documentation balances both needs:

  • Embed YouTube videos: Add short video walk-throughs to guide users through the metrics, reducing follow-up emails.
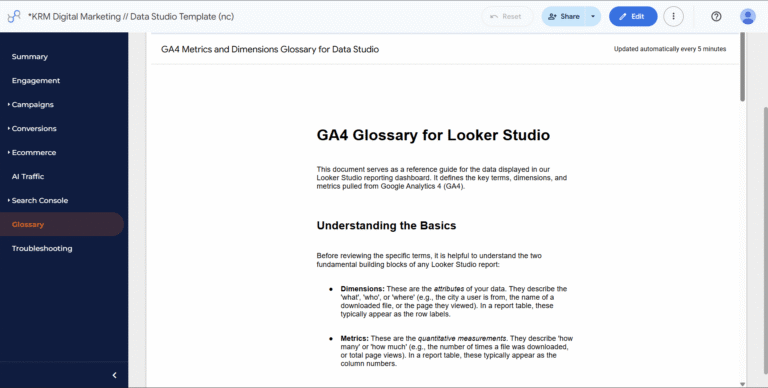
  • Embed Google Docs: Insert live Google Docs containing glossaries or troubleshooting guides directly beside scorecards.
  • Enable drill-down dimensions: Allow users to drill down into dimensions or view optional metrics without cluttering the canvas.
Embedded Google Doc in Data Studio

Summary

So there you have it – some quick wins and new approaches that might help build those Data Studio dashboards quicker.

Frequently Asked Questions

How do I copy only formatting styles in Data Studio?
Select the styled chart, press Ctrl + Alt + C (or Cmd + Option + C on Mac), select your target chart, and press Ctrl + Alt + V (or Cmd + Option + V).

What is the benefit of making an element report-level?
Setting an element to report-level makes it appear in the exact same position across every page, saving setup time on global controls like date pickers and headers.

Can you embed external documentation directly inside Data Studio?
Yes. Data Studio allows you to embed external content using URL embeds, including YouTube videos, Google Docs glossaries, and user guides.

Kyle

Author

Hello, I'm Kyle Rushton McGregor!

I’m an experienced GA4 Specialist with a demonstrated history of working with Google Tag Manager and Looker Studio. I’m an international speaker who has trained 1000s of people on all things analytics.

Scroll to Top