Source Group Dimension in GA4

July 10, 2026

Most digital marketers have spent far too long looking at reports split across Facebook, FB, meta-facebook, and fb.com, trying to manually bundle them together to see if a campaign actually worked. 

It is frustrating, time-consuming, and makes cross-channel reporting a massive headache.

Google has quietly rolled out a solution that addresses this exact issue.

It is called the Source Grouping dimension, and it makes your cross-channel reporting much cleaner.

It automatically bundles those messy, disparate source values into high-level categories like Facebook or Instagram, allowing you to focus on strategic adjustments rather than manual data cleaning.

Table of Contents

Key Takeaways

    • Automated Consolidation: GA4 automatically bundles messy variations of the same referral source into a single, clean platform name.
    • Historical Data Support: The new dimension applies retroactively, meaning you can clean up and evaluate past campaign data instantly.
    • Specific Location: This feature lives within the Advertising section, specifically inside your conversion and attribution reports.
    • True Cross-Channel ROAS: By combining imported cost data with this unified dimension, you can accurately compare revenue and assisted conversions across different platforms.

Why Source Grouping Matters for Your Reporting

Cleaning data manually is an inefficient use of time.

The new Source Grouping dimension brings together disparate sources into one high level source group.

An example of this is putting fb.com, facebook.com, meta-facebook into one group called Facebook.

This provides clearer granularity for third-party platforms like:

  • TikTok,
  • Pinterest, and
  • Amazon,

alongside standard Google inventory like YouTube, Search, and Maps.

What is particularly helpful is that Google has included built-in grouping for emerging traffic sources.

If you are starting to see referral traffic from modern AI platforms like ChatGPT and Perplexity, GA4 will categorise these properly too.

Plus, because this dimension populates retroactively, you do not have to wait weeks for new data to accumulate.

You can use it to analyse your historical data right away to spot performance opportunities and optimise your advertising budget.

The good ol’ days

This goes some way to giving what was available in Universal Analytics – a social media report.

Finding the Source Grouping Dimension

If you have spent the last few minutes hunting for “Source Grouping” in your standard Traffic Acquisition reports, you can stop clicking around.

You will not find it there just yet. I spent far too long checking this!

After some verification with Google, it turns out this dimension lives within the performance and attribution sections.

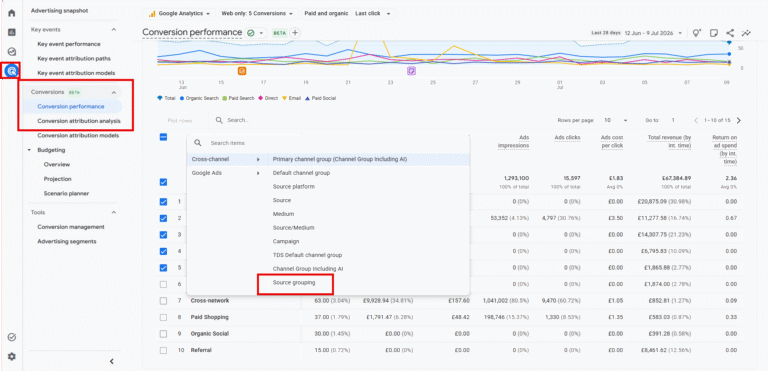
To find it, click on Advertising in the left-hand menu, and then look under Conversions for the Conversion performance report. When you open the report, it automatically displays the Primary Channel Group.

Click that drop-down menu, and you will see Source grouping waiting for you.

Source Grouping Report

Understanding the Report

Once you switch the report to Source Grouping, you will see disparate channels brought together under clean headings like Facebook, Bing, Instagram, and YouTube.

Because this is a conversion report, the metrics focus heavily on outcomes and key events.

You can see data-driven conversions and, crucially, cost data.

If you import your ad spend data from platforms like Facebook, GA4 will overlay that cost against your revenue.

This gives you an immediate, accurate view of your return on ad spend (ROAS) by specific channel.

Assisted Conversions

But what about the conversion paths that are not a straight line?

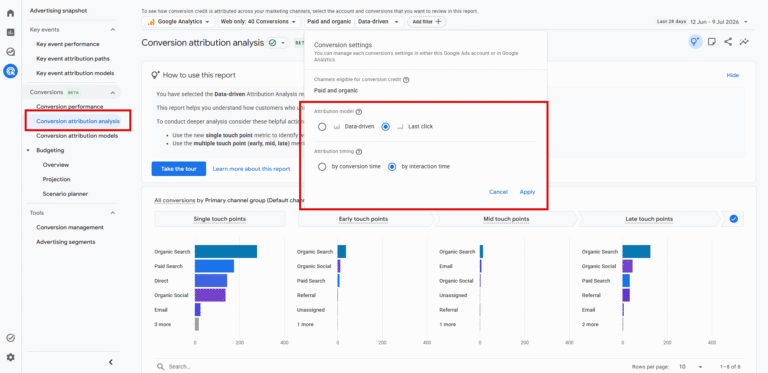
If you click on Conversion attribution analysis and look at Last click by interaction time, you can apply the Source Grouping dimension there as well.

This opens up a highly useful attribution report.

This setup reveals the number of interactions that occurred before the final touchpoint in a conversion path. You can see assisted conversions and the exact revenue attributed to those early interactions. It helps you understand which channels are doing the heavy lifting early in the funnel, ensuring you do not accidentally switch off a campaign that is quietly driving your conversions. For a deeper look at setting up your initial data streams, see our complete guide to GA4 conversion tracking here.

Assisted Conversions

Summary

Tracking cross-channel performance does not need to involve endless regex, or building out custom reports.

By using the new GA4 Source Grouping dimension, you can filter out the noise, evaluate historical performance, and see exactly where your budget delivers the best return.

Frequently Asked Questions

Why can’t I see Source Grouping in my Traffic Acquisition report?

Currently, Google has only rolled out the Source Grouping dimension within the Advertising workspace, specifically in conversion and attribution reports. It is likely to appear in standard reporting later, but for now, you must access it via the Advertising menu.

Does GA4 Source Grouping apply to older data?

Yes. Unlike many new configurations in GA4 that only track data moving forward, Source Grouping is applied retroactively. This allows you to evaluate your historical campaign data immediately.

Can I see ROI or ROAS within the Source Grouping report?

Yes, provided you have integrated your cost data. If you import ad spend from third-party networks like Facebook, GA4 will align that cost with your unified source data, allowing you to view clear conversion and ROAS metrics.

Kyle

Author

Hello, I'm Kyle Rushton McGregor!

I’m an experienced GA4 Specialist with a demonstrated history of working with Google Tag Manager and Looker Studio. I’m an international speaker who has trained 1000s of people on all things analytics.

Scroll to Top