How to Edit and Delete GA4 Data Streams
Follow this quick guide all about updating your data stream.
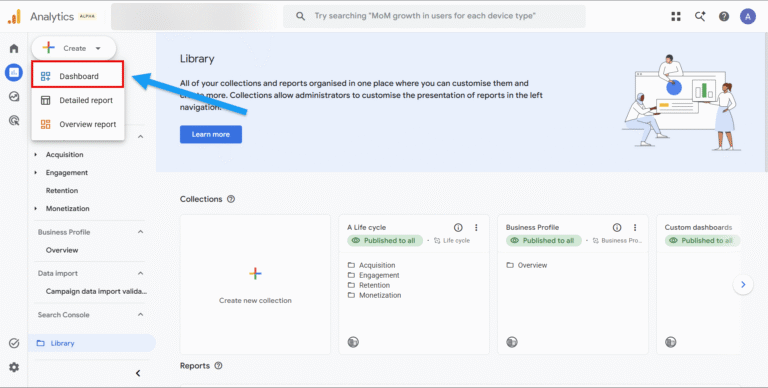
Standard overview cards and tabular reports in Google Analytics 4 are helpful, but they don’t always give stakeholders the exact high-level snapshot they need in one place.
That is where custom dashboards in the GA4 Reports section come in. It’s a new feature (well, it was new when I wrote this)
Think of this feature as a lightweight Data Studio built straight into your analytics interface.
My thoughts – this is a useful new feature, but shouldn’t replace Data Studio.
Let’s dig in to see what on earth I’m on about!
Native Analytics Hub: Custom dashboards in GA4 allow you to build a single-page, consolidated KPI summary right inside the Reports section, functioning much like a lightweight Data Studio.
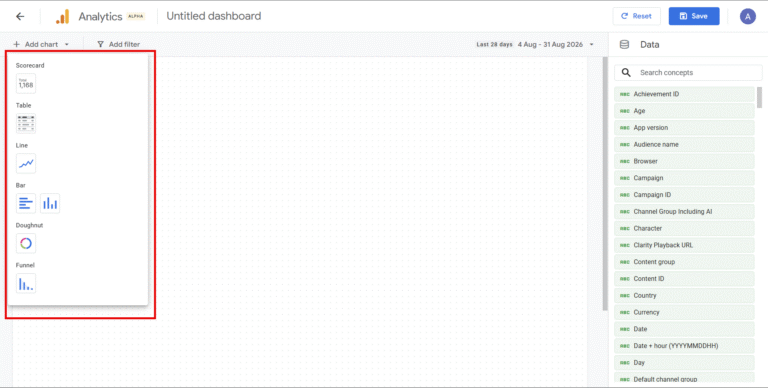
Simple Interface: You can drag and drop scorecards, line charts, bar charts, doughnut charts, tables, and funnels onto a flexible grid canvas, then publish them straight to the left-hand menu.
Role-Based Permissions: Creating and publishing requires Editor or Administrator permissions, but once published, any user with property access can view and use the dashboard.
Key Constraints: Standard properties support up to 15 cards per dashboard (30 for GA4 360), all dashboards are public to the property, and native segment or API support is not available.
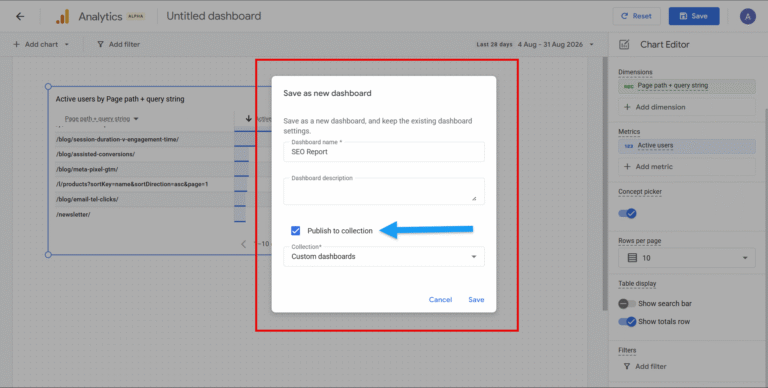
Setting up your first custom dashboard is straightforward once you know where to look in the interface.
Follow these steps to create your custom view:
When customising your canvas, you can select from six visualisation types:
If you add a line chart – any annotations that you have added, will be visible.
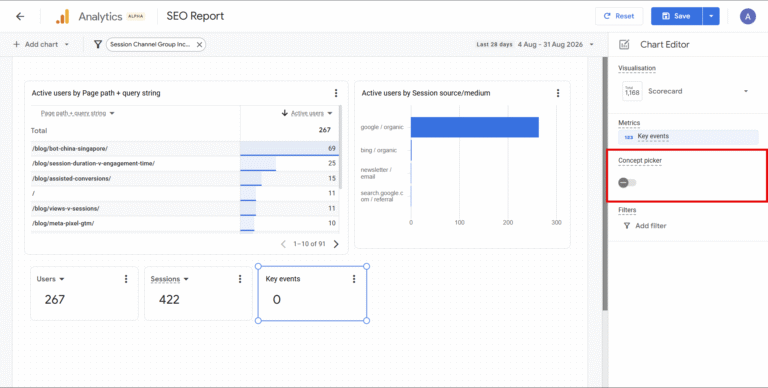
Toggling this on, means that a user can change the dimension / metric in the visualisation in view mode.
What a concept!
Once your visualisations are set up, you can configure filters to focus on specific channels or user activities.
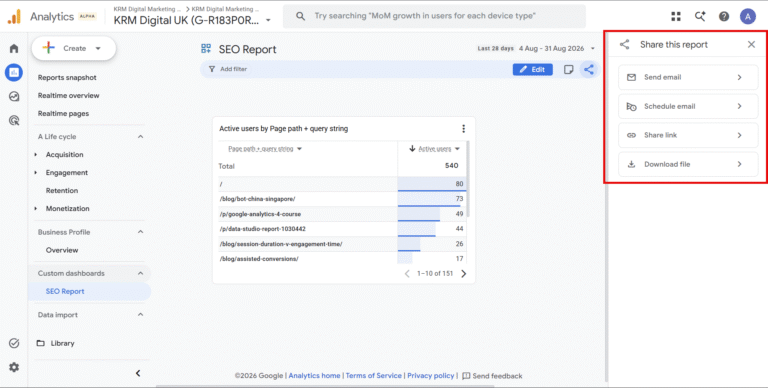
To add to this, you can schedule automated email distributions or share direct links with team members so everyone stays informed.
I can see this as a great addition to customising SEO reports for example – building out more bespoke charts.
Frustatingly though, you can’t currently share this across properties.
While native dashboards offer impressive convenience, they do have specific limitations that you should keep in mind during your setup:
Building custom dashboards directly inside the Google Analytics 4 Reports section gives your team rapid access to vital performance metrics without requiring external reporting tools for quick updates.
By consolidating core KPIs into a single published view, you save time and keep stakeholders aligned on key business goals.
Who can create custom dashboards in the GA4 Reports section?
You need an Editor or Administrator role within the GA4 property to create, customise, and publish dashboards. Users with Viewer permissions can access and interact with published dashboards once they appear in the left-hand menu.
Can I keep a GA4 custom dashboard private to my account?
No. All dashboards created and published in the Reports section are visible to anyone with property access. If you need a private workspace for ad-hoc analysis, create a report within the Explore section instead.
How many visual cards can I add to a single dashboard?
Standard GA4 properties support up to 15 visualisation cards per dashboard. GA4 360 properties support up to 30 cards per dashboard.
Can I apply filters and schedule automated emails for these dashboards?
Yes. You can apply custom filters to refine the data on your dashboard canvas. Once saved, you can share the dashboard using direct links or set up scheduled email delivery to send regular updates to key team members.

Follow this quick guide all about updating your data stream.
Speed up your Data Studio reporting with practical shortcut, layout, and component tips
Validate non-Google ad spend, clicks, and impressions in GA4 using the new Campaign Data Import Validation Report.

Learn how adding the GTM Container ID variable makes debugging faster and keeps your reporting accurate.

Author
Hello, I'm Kyle Rushton McGregor!
I’m an experienced GA4 Specialist with a demonstrated history of working with Google Tag Manager and Looker Studio. I’m an international speaker who has trained 1000s of people on all things analytics.