Managing multiple sites with one GTM container
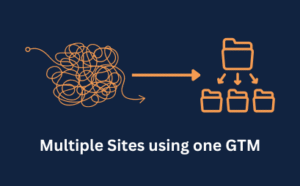
Learn how to consolidate multiple domains into a single Google Tag Manager container and save hours of administrative work.


Learn how to consolidate multiple domains into a single Google Tag Manager container and save hours of administrative work.


Learn how to implement the Meta Pixel in Google Tag Manager using the Stape template.

Learn the four distinct types of GA4 events and how to set them up