The Funnel Report in GA4 – How to Visualise and Increase Revenue and Conversion
When Google decided that Google Analytics 4 (GA4) was going to be the default analytics property and that Universal Analytics (UA) was to be deprecated, there were groans from digital marketers. Change is a constant in digital marketing, but for many, grappling with GA4 is one change too many.
There are those who advocate for GA4 (and I’m one of them) but for many there are a myriad of challenges that GA4 introduces including:
- A new interface without the level of accessible reports that were available in Universal Analytics
- Differences in reporting methodology producing data variances, that often can’t be explained
- A set up approach that’s wholly different to UA.
Table of Contents
What can you get from the Funnel report in GA4?
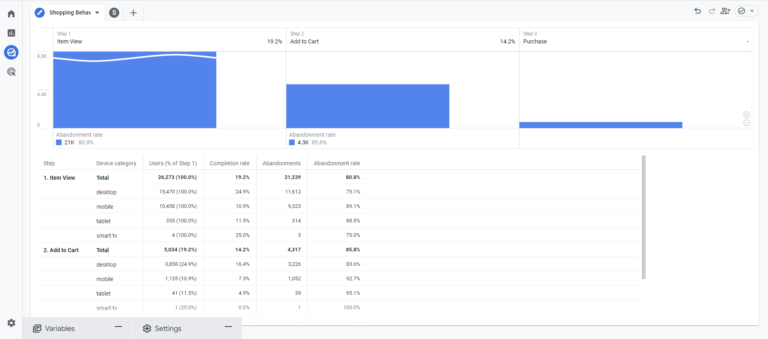
The funnel report lets you visualize the steps users take on any particular user journey on your site. It provides analysis around abandonment rate, elapsed time, and a breakdown by a specific dimension (my favorite is the device category).
Hence, you understand where users are leaving your journey and make changes to improve.
The optimization leads to more:
- Revenue
- Sign-ups
- Donations
- Demo requests
A similar report was available in Universal Analytics, but it was difficult to understand. The interface was clunky, the customization options were limited and many people ignored the report.
Ignore the funnel report in GA4 at your peril.
The Funnel exploration report adds new features, interface, and customization options. This makes it really easy to understand what’s happening on your site ,– and crucially –you can improve it.
This report isn’t just suitable for ecommerce sites and their checkouts, you can analyse any particular user journey – no matter your niche.
So, if you are:
- A SaaS business with a ‘Request a Demo’ contact form
- An organisation with an online onboarding process
- A charity / third sector organisation seeking donations
- Looking to understand user journeys from an email
Then the Funnel exploration is the report for you.
Let’s get stuck in.
Where to find the Funnel exploration
The Funnel exploration is a little hidden away, but dig into GA4 and you’ll soon find it.
- Log into your chosen Analytics property (make sure it’s GA4, not UA – you’ll find out soon enough)
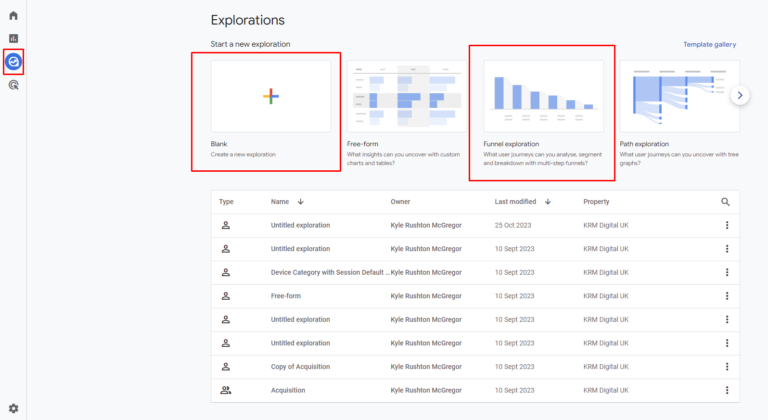
- Click on the ‘Explore’ function
You now have two options (too much choice). You can either:
- Choose the templated Funnel exploration in the selection at the top, or
- Choose blank template and then choose Funnel report in the technique section (in the settings area)
Creating a funnel explorations
Whether you choose a funnel exploration template, or decide to start with a blank template, the process of creating a funnel report is the same.
And it all starts with Steps (not the 90s band). Steps helps you to outline the journey that you want to focus on. So if you have a specific set of pages that you want to track e.g:
- User lands on Page A and then,
- Moves onto Page B before completing a form and,
- Landing on Thank You Page
Or are an ecommerce site and want to track the user journey of a checkout using the stand GA4 ecommerce events:
- Add to cart
- Begin Checkout
- Add Shipping Info
- Add Payment Info
- Purchase
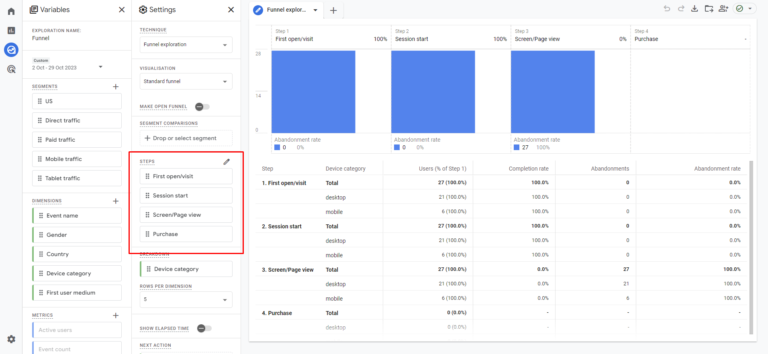
Click on the edit steps pencil and add the steps you want to track. The world is your oyster here (but if you’ve started using a pre-made template, you’ll want to delete what’s already there). You would add a new step for each distinct part of the user journey.
For each step you can add conditions that the user must meet in order to be included in that step.
For example, you could include a step with the condition Landing Page + Query String contains /blog/ or if Event equals Add to Cart.
You can add multiple clauses to a condition with the AND or OR function.
For the next part of the user journey you can click ‘Add Step’ incorporating more conditions and steps as you go along until you are happy that you have fully mapped out your user journey.
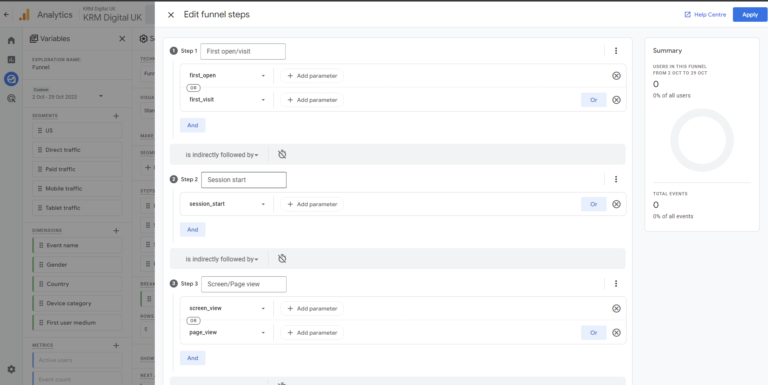
All is not done yet however, there’s a few clarifications you’ll need to make. For each step you’ll need to decide whether the previous step is indirectly followed by or is directly followed by the new step.
What does that even mean?
Well – indirectly followed by means that inbetween the two steps there can be other actions, whilst directly followed by means the step has to occur immediately after the previous step.
But wait, there’s more, you can even include a time frame. So you can choose to say that a new step must happen within a set time frame from the previous step.
Once you’re happy with the steps you’ve created, click Apply. And et voila! A funnel exploration is born.
Additional Options for your funnel exploration
There are additional functions available to you (if you so desire) to help with your funnel exploration.
Open / Close funnel
You can choose to have an open or a closed funnel. And the difference is quite simple really. An open funnel means that a user can enter the funnel at any stage of the funnel, whilst a closed funnel means that users must enter the funnel via the first step that you’ve outlined.
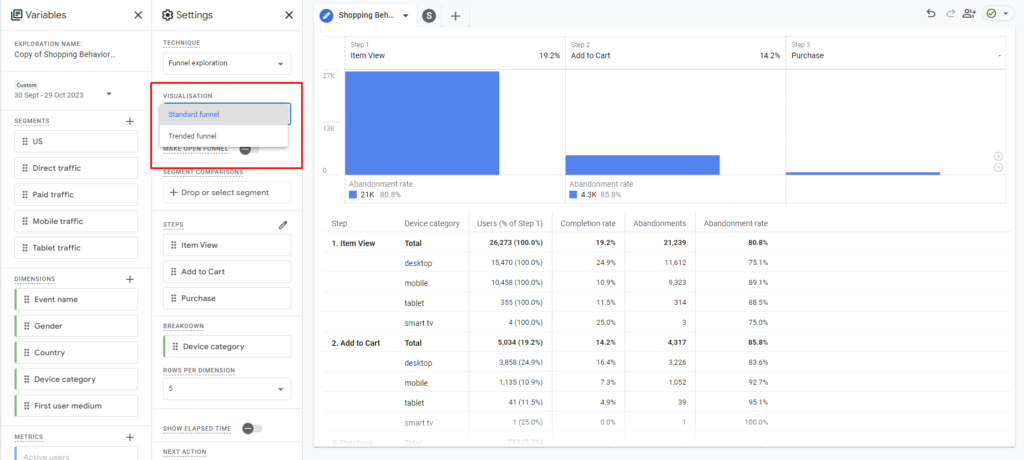
Different visualisation styles
For me, the most useful visualisation of the data is the standard funnel – which has an easy to understand bar chart outlining drop off by each section of the stage.
But, there is another. The trended funnel option gives you an understanding of users through each stage of the step over time.
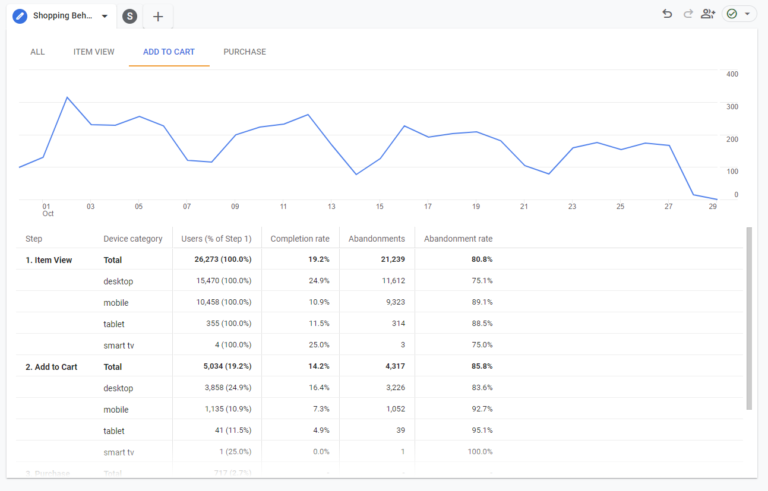
This option is really useful if you know you’ve made changes and want to have a quick visualisation of any change (positive or negative) that has occurred. With the trended funnel report you can even focus on one particular stage of the journey by clicking on the tab.
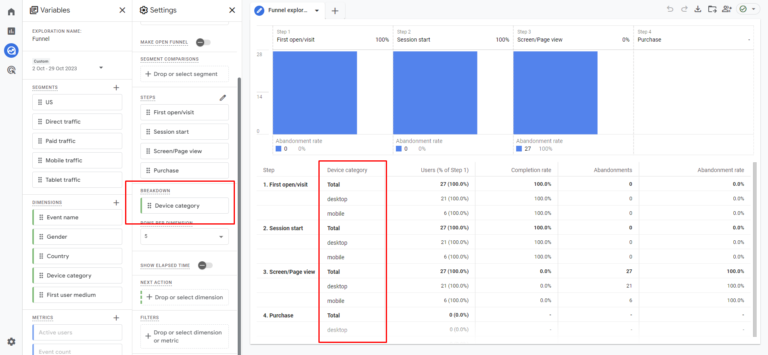
Breakdown
If you want to see how your journey performs based on a particular, you can using the breakdown function. My favourite way of using this is by Device Category, but how about Session Default channel grouping or Country? All useful breakdowns to add additional granularity to your funnel exploration.
When you’ve added a breakdown you’ll see that reported in a table underneath the bar / line chart.
Segments
Segments are another great way to add granularity and layers to your data insights. Say if you wanted to compare Paid Users from the US with Paid Users from the UK, then creating these as segments makes that possible.
If you were using a standard funnel, you’d then see the segments outlined in your report. Hovering over the specific segment in the visualisation would highlight that journey.
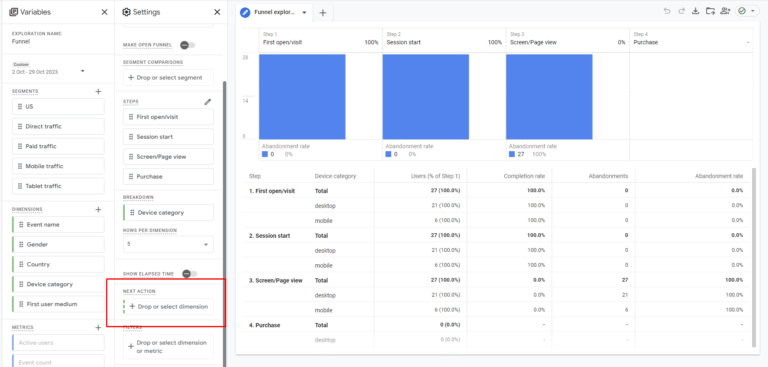
Next Action
Are you seeing abandonment rate (discussed below) at a higher than normal rate and not sure what your users are doing – then included the ‘Next Action’ function.
By choosing this option, when you hover over a step in your report you can see what the user next takes – helping you to understand the journey as is versus the journey you want it to be.
Elapsed Time
Elapsed time is another useful function for digital marketers to help to understand the user journey.
By including this option, you can see how long on average, users need to jump from step to step.
Filters
You can also narrow down or get a more succinct report by using the report function.
Want to see just users from social media, use a filter. Want to see users who land on a specific landing page, use a filter. Interested in a particular gender or age bracket, there’s a filter for that.
Understanding the report
Within this paragraph I will provide an understanding of how to assess and understand the funnel report once created by looking at:
- Abandonment Rate
- Completion Rate
- Breakdown report
I will use a real case example to provide analysis and potential actions you could take to improve the situation.
So, you’ve completed the steps, added your variables and now you’ve got a beautiful visualisation of your user journey. Now what? How do I understand the report?
Difference between steps too large – you can either hover over a bar chart and scroll up and down to change the visualisation.
Similarly, there is also the option to click the plus / minus option in the bottom right of the displayed data to zoom in a little.
Retention Rate
Starting at the top of the report – you’ll see a percentage next to each of the steps (that you’ve helpfully named something relevant) – this is your retention rate – the percentage of users who successfully move from that stage to the next stage in your funnel.
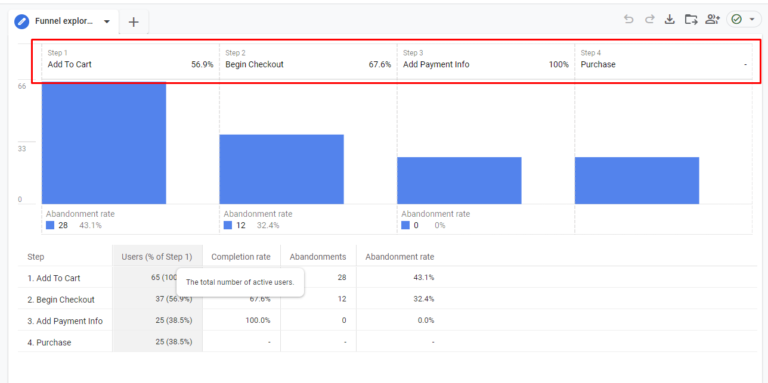
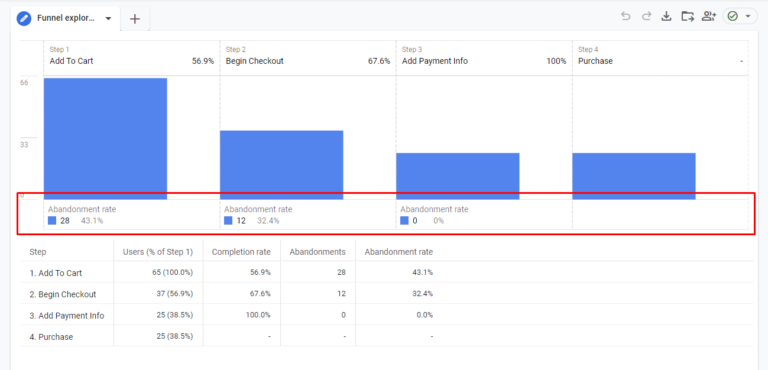
Abandonment Rate
So you’ve got completion rate, well underneath the bar chart, there’s the abandonment rate, helping you to understand what percentage of users leave the journey you’ve set out.
For example, in the Funnel exploration above you can see abandonment rates of 43.1%, 32,4% for the Add To Cart and Begin Checkout step.
As Step x the x step has the highest abandonment rate – maybe for me, the focus would be on improving the journey at that particular stage – and spending the time understand why that could be.
If you have added a breakdown option, then maybe it helps to illuminate where the issue is.
For example, if you’ve added ‘Device category’ as a breakdown, does that help illustrate an issue? For the step that has the largest abandonment rate, is there a discrepancy between Mobile versus Desktop? If so, maybe there’s an issue with how the site loads and looks on mobile – something to investigate for sure.
Segments from Funnel
Noticing something interesting in your funnel report and what to create a segment based on that. Well, you can. Hover over the particular step in the journey you are interested in and right-click, you then have the option to ‘create segment from users’.
The same goes for those who have abandoned the process. Hover over the numbers in the Abandonment rate section and you’ll be able to create a segment from this.
Breakdown Report
In the breakdown section, well, it does exactly what it says on the tin. Here, if you’ve added a breakdown dimension, it will provide you with an understanding of abandonment rate, users and elapsed time (if that’s been chosen)
Funnel Exploration use cases
So now that we have an understanding of the what, where’s and why’s of the funnel report, let’s dig into some specific use cases.
We’ll explore:
- Ecommerce
- B2B Saas
- Third Sector / Charity
- Email Marketing
- Onboarding process
I’m sure as we go through these you’ll find that the examples used will have uses in other areas and other niches.
These examples are not an exhaustive list and that it’s important to think about your own journeys on your own sites to understand how an exploration report in GA4 can help.
E-commerce
If you have an e-commerce site, knowing and understanding the checkout process is vital. If you can pinpoint areas where your potential customers are dropping out of the checkout process then you can make effective changes. These changes could get the e-till ringing more and help to improve the bottom line.
Whether you have e-commerce set up by Shopify, or Woocommerce (other platforms do exist) or you’ve set up e-commerce tracking with the support from a developer – the events and process should be fairly standard for GA4 tracking.
If you’re looking to understand the events that should be sent for e-commerce tracking, you can read this document from Google here.
The steps you can create are all event-based and would take the form below:
- Step 1: Name: Add to Cart, Event equals Add To Cart
- Step 2: Name: Being Checkout, Event equals Begin Checkout
- Step 3: Name: Add Shipping Info, Event equals Add Shipping Info
- Step 4: Name: Add Payment Info, Event equals Add payment Info
- Step 5: Name: Purchase, Event equals Purchase
You may also find it valuable to add events such as viiew_item_list or select_item at the start of the process.
Note if you are using Shopify, then the Add Payment Info is not a standard event that is sent using the native GA4 connector.
With this funnel set up you can ask:
- Are you losing people at the add shipping or payment info section – and what does that mean?
- Could you find ways to reduce the number of fields required to be filled out?
- Are the payment options available too narrow? Could you add alternative financing if applicable e.g. Klarna or ClearPay?
- Does the free shipping requirement turn people off?
All of these things could be the reason that you are finding a higher abandonment rate at the add payment or add shipping section.
B2B SaaS
Although a Software as a Service (SaaS) organisation might not have a checkout option (although, if you do, you should still follow the process above), there are key journeys that users take that are really important for you to know and understand.
One of these could be a Request a Demo contact form, or a Contact Us page that is your main lead generation form. Both of these could then lead to a thank you page.
The steps you can create may not be as explicit as the checkout process above but might follow the journey below:
- Step 1: Name: Landing Page, Landing page equals {the name of the landing page for your main service/services}
- Step 2: Name: CTA Click, Event equals CTA click {an event you’ve created for tracking the click of your CTAs)
- Step 3: Name: Request a Demo page, Page view equals the Request a Demo page
- Step 4: Name: Thank you page, Page view equals the Thank you page
This would absolutely shift and change depending upon the particular journey for your SaaS business, but you should be able to see clear examples of abandonment across the funnel.
If you are finding people are abandoning at the landing page:
- Is your copy compelling enough, does it clearly provide the solution they are looking for?
- Are the Call to Actions clear enough?
- Are you providing too many opportunities to go on different journeys?
- Are there too many opportunities to click elsewhere?
How about at the Request A Demo contact page?
- Do you ask too many questions? Like, is it really important at this stage to know how many employees they have?
- Are the next steps not clear to the user?
Are you utilising case studies or user reviews illuminated well enough? - All of these things will help to illuminate where you are losing your users – and crucially, how you can make a difference.
Third Sector Charity
Charities and the Third Sector are always on the lookout for additional resources to support their vital work. And seemingly, these days, the challenge is greater.
But how good would it be if you were able to understand where you are losing potential donors and supporters? Just a small improvement in conversion rate, for example, could see a big shift in revenue.
Totally hypothetical – If an average donation was £100, and you saw 2 donations a day with a conversion rate of 2% (so 2 in every 100). If you improved that conversion rate to 3%, that would be an additional £36500 – just by being able to improve the conversion rate.
And you could do that by understanding the donation journey:
- Step 1: Name: Landing Page, Landing page equals {the name of the landing page for your main service/services}
- Step 2: Name: CTA Click, Event equals CTA click {an event you’ve created for tracking the click of your CTAs)
- Step 3: Name: Donation page, Page view equals the donation page
- Step 4: Name: Add Payment Info, Event equals add payment info
- Step 5: Name: Purchase, Event equals Purchase
You can see here that I’ve utilised some of the e-commerce tracking – and why not, it’s still an online business.
If you’re finding people leave at the landing page stage, they might find your content not compelling enough, or maybe you haven’t explained what the funds will be used for.
And on the donation page – are you fully reiterating the value of the donation – and what it’s going towards?
At the donation page – again, are you asking for too much information? Or if the information is required, are you explaining why?
Lots of people leaving at the landing page stage? Well, as compelling as the copy is, are you targeting it correctly? You may well be running social or paid ads that are driving plenty of users, but if the targeting is wrong on the ad, then you’re gonna have a bad time.
These are just some of the reasons why you could see some challenges with your donation process – and knowing where those kinks and creases are, could make a huge difference to the organisation – and the people it supports.
Email Readers
Another really useful way of using the Funnel report in the exploration section of GA4 is to understand where you are losing your email subscribers.
If you have asked something of your email subscribers e.g. donate, buy this product, read this page etc, then you should be able to track their progress (and see where they are dropping off).
A typical funnel might look like this:
A segment of Session default channel grouping exactly matches Email
- Step 1: Name: Landing Page, Landing page equals {the name of the landing page for your main service/services}
- Step 2: Name: Scroll, Event name equals Scroll, Page view equals the name of the landing page
- Step 3: Name: Page 2, Page view equals next page of the journey (you could then continue this theme until you complete the journey)
- Step 4: Name: Event Form (this could take the form of the ask you requested in the email).
I included the scroll event so that you can see how far the user gets down the page, it could be an illustration of how the page is reading.
You might find that there is a lot of abandonment at the landing page first step, which might illuminate the task as confusing, or not clear. Ultimately, the content on the page might not reflect what is said in the email or isn’t answering the problems.
If you are finding that your users are getting all the way through to the contact form (or similar endpoint) but then abandoning, then are you asking too many questions? Are you not highlighting the positives again by highlighting the positives again with feedback from your existing customers?
If you know that your email subscribers are large drivers of revenue and support for you, then ensuring that you’re maximising every opportunity by analysing their journey is key.
Onboarding process
Do you have paid clients who need to answer a few more questions? Forum members that you need more info from? Then the onboarding process that you outline in a funnel exploration can really help understand that journey.
An onboarding process can be many things to many people. It could be:
- An HR software company looking to gather business information
- An online forum wanting to gather personal information
- A financial or insurance company looking to tailor their support
I don’t want to be so prescriptive by highlighting specific steps because an onboarding process will be as unique as the product that is being sold.
However, you should understand each step of your onboarding process and create that in your funnel.
This process could be fairly easy if each part of the process is a different page – allowing you to track the onboarding process page by page. But, if the set up is different, you might want to utilise support from a developer or use tag manager, so that each step is tracked by an event, and then you can set that up in the funnel report.
You could even use the time constraint functionality within the steps process. This way you could suggest that each step takes a certain amount of time, and if you are finding that isn’t happening, then maybe there’s a question or functionality that is stumping your customers.
This funnel exploration should really illuminate areas of improvement – if you’re finding abandonment rate is high for one particular step, then you’ll know where those bottlenecks are.
Adding it to reports
You’ve created a brilliant funnel report and want to show it off to your parents, partner and the dog. But mostly, other members of the team or your clients. Well, the funnel exploration is the only exploration that allows you to add it to your report section in GA4.
This means that all users of the GA4 property will be able to see the visualisation and understand the abandonment and retention rate. It also means that users can change the date range and understand the funnel across different time frames.
But if you want to see the next action, segments or elapsed time in this report, they are not included when moving the funnel from the exploration section to the report area. Booooo.
Here’s how:
- Click on the ‘Save as a report in the library’ button in the top right
- Enter a name and a description (descriptions are always nice when you have multiple GA4 users – so others know what on earth the report is about)
- Save it
- Head to your report section and click on Library
- In the section, choose a current collection or create a new collection
- Find your saved funnel exploration report
- Drag and drop it into your collection
- Click save and save changes to the current collection
If you’ve created a new collection, then you’ll want to publish this by clicking on More > Publish.
Once you’ve got this funnel report added to the report section, you can only delete or rename the funnel report. So after a period of reflection, it’s clear that you need to adjust a step or make a change, then you’ll have to recreate the exploration and then go through the same process as outlined above.
Sharing Reports
You can add it to reports as demonstrated above, but that’s not all. There are other sharing options available to you.
This includes:
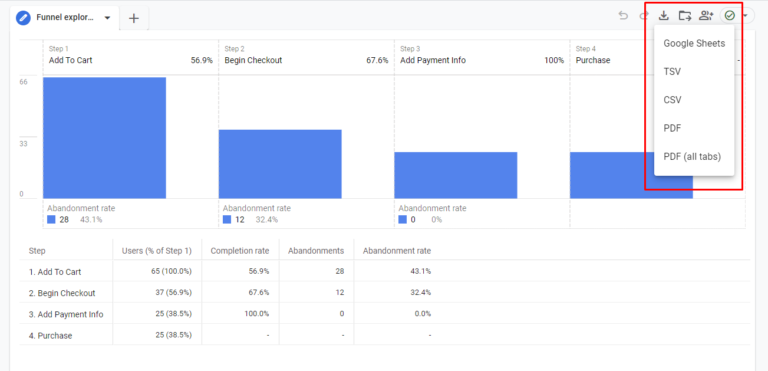
- Exporting the data via Google Sheets, TSV, CSV, PDF and PDF (all Tabs)
- Sharing the exploration in read-only mode within the exploration section
External sharing
You can export the data via a variety of different formats. Click on the ‘Share’ option and choose your exporting poison. What I particularly like is the PDF All Tabs option, meaning that you can create the funnel exploration along with other reports in a single report (by adding new tabs) and then export that out.
NB. the additional tabs present a new opportunity with the Funnel exploration too – if you’ve got different journeys on your website, then create Funnel exploration reports for them all and house them in one report. These are brilliant for sharing and discussing with the wider team and finding commonalities with them all.
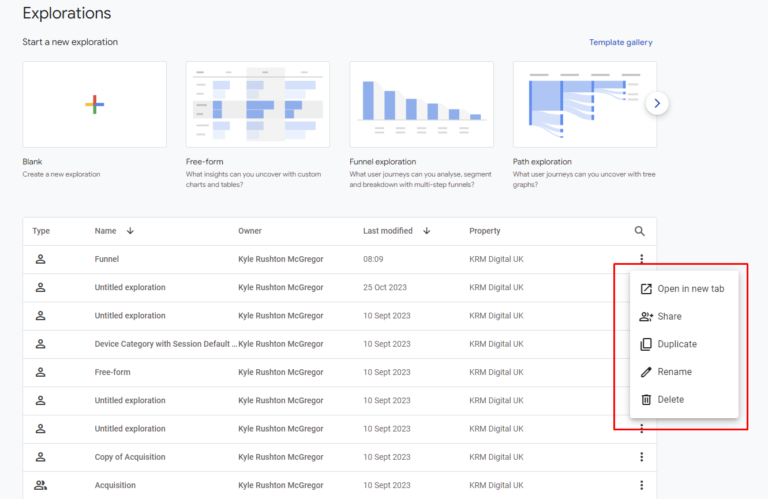
Sharing Internally in the Explore section
You also have the option to share your wonderfully created report within the explore section. To do this, in the explore section, click on the three dots next to your report and click ‘share’.
This allows you to share the report in read-only mode.
Therefore, whilst other users can view your exploration in the explore area, they can’t amend any of the variables etc that you’ve set up. Crucially, this includes the date range option, meaning it’s often stuck on the same date range you selected initially. So, if you chose the last 30 days as the date range option, it will always be the last 30 days when you shared the exploration. If someone were to view your exploration in a few month’s time, the date range would be stuck to the 30 days previous from when you shared it – that’s not very helpful!
The best practice here is that users can then duplicate your report, giving them the option to change any variable they see fit (and probably break the report if they aren’t an expert like you) but at least they can change the date range.
All in all, if you want to present your exploration to GA4 users, saving it as a report in the library and adding it to a collection is probably the best way to do that.
Building a funnel exploration today
How does all that sound? Are you excited to get stuck into creating an exploration? I bet you are! I know there are frustrations with GA4, but with the funnel exploration, you have the option to visualise a user journey, understand where it’s not working and make a change. This could mean the difference between hitting targets or not.
As demonstrated above there are a myriad of different ways to use the explore function, no matter your specific niche. And I’d invite you to spend the time to understand the user journeys on your website and how to recreate those as steps using different devices. The visualisation it can then offer might be a real eye-opener. I know it has been for me and some of my clients.
Often there’s an expectation of how a user is progressing through a site, well, as funnel exploration really allows you to put your money where your mouth is and see if that expectation meets reality.
With the funnel report opening up insights, it’s vital that you don’t stop there. Combining this information with more qualitative data will help illuminate the reasons why there is an abandonment. So, utilising heat maps, exit intent polls etc will provide a more holistic understanding of user frustration meaning you can make a more confident hypothesis of what’s causing the issue – and why you should make the change.
And that’s the crux – data is all well and good, but really without action, it’s kind of pointless. Taking that data and making a change is what’s important – and can mean more donations, more sales, more sign-ups and a happier boss/client – who doesn’t want that?

Author
Hello, I'm Kyle Rushton McGregor!
I have been working in PPC and SEO for over a decade now. I have expertise in supporting charities, SAAS and B2C – helping them drive more traffic and conversions. My experience covers